Showing posts sorted by relevance for query american dream. Sort by date Show all posts

Sunday, 21 August 2011

The age of financial repression and the shattered American Dream

One year one, QE2, the wealth effect experience, induced by Ben Bernanke has been nothing but a failure.

With interest rates at zero since 2008, income from US Treasuries and Certificate of Desposits have been nothing but short of miserable for pensioners.
And not only did the 401K, took a recent beating, but the house, previously used as an ATM, in the build up to the financial crisis, is no longer an instrument for pensioners to extract additional income and even help out the younger generation facing up with an increasing burden of student loans.

As per CalculatedRish recent post, here is "The New Retirement Plan: No Retirement"

http://www.transamericacenter.org/resources/TCRS12thAnnual%20WorkerNewRetirementFINAL05162011.pdf

What we learn from the survey mentioned is fairly dramatic:

39% of workers plan to work past age 70 or do not plan to retire.
54% of workers expect to plan to continue working when they retire.
40% now expect to work longer and retire at an older age since the recession.

"Fewer than one third (30%) have currently saved more than 100,000 USD in all household retirement accounts.
Most workers regarless of age or household income, agree that they could work until the age of 65 and still not have enough money saved to meet their retirement needs."


But it gets worse
"31% anticipate that they will need to provide financial support to family members."


As I indicated in "The end of the American Dream, the call for trade barriers and the rise in populism...", "There are 70 million Americans born between 1945-1960. One-third have zero retirement savings. The oldest are 64. The only money they have is equity in a house, so they must sell. This will add yet another flood of houses to the market, driving prices down even more."

In relation to the survey mentioned above they conclude with the following recommendation to the policymakers:
"From a public policy perspective, with so many workers planning to work past age 65, policymakers should consider tax incentives for employers to hire older workers along with job training / retraining programs for older workers -- to help keep them in the workforce."

But the issue is not only in the retirement space, there is a steady build up in the student loans space and given the house is no longer there to provide equity withdrawal to support younger generations, it is a growing concern, because rising education costs is also affecting consumption levels to some extent.

I also wrote the following in September 2010
"Even young graduates have become disillusioned, will they be able to therefore repay their student loans?"
"Student loan amount has exceeded the total credit card debts for the first time in the American history.":
"The total outstanding student loan is worth 850 billion USD and the most worrying factor is that some students do not even know on how much they owe and to whom..."

Now student loans are close to 931 billions USD, eclipsing 798 billions in credit card debt. Some experts estimate we could hit one trillion this year alone. Total student debt was 72 billions USD 15 years ago according to Mark Kantrowitz, who provides financial assistance for college students via financial aid website www.finaid.org.
crazy student loans 2011-q2.png

Defaults on student loans nationwide have doubled in the past five years and are on the increase:

Only credit cards have a higher rate of delinquency at 12.2%, but  as indicated  in the below graph from St Louis Fed, overall, delinquencies are falling.
The unemployment rate for workers between 20 and 24 years old is 14.6% compared to 9.1% for the national average. According to Moody's the defaults on securitized private student loans rose to 5.4% in the second quarter. The annualized default rate widened from 5% in the first quarter and 4.5% a year ago, most coming from loans securitized in 2010, containing more delinquencies. The default rate peaked at 7.6% in the third quarter of 2009.

The deleveraging of US Households is still the most important story relating to the ongoing balance sheet recession:
Graph of Household Debt Service Payments as a Percent of Disposable Personal Income

The end of the American Dream of Home Ownership has been dented and its slowely but surely reversing back to the mean:
Graph of Home Ownership Rate for the United States

A concern is the rising trend in consumer loans at all commercial banks for our struggling US Household:
FRED Graph

There is a stronger demand for consumer loans:
Graph of Net Percentage of Domestic Respondents Reporting Stronger Demand for Consumer Loans
The good news it seems so far is that delinquencies on all loans and leases, to consumers, all commercial banks, is trending down, but again, there is what we see and what we don't see and if we end up moving back into recession, which looks like almost certain now, the picture could change rapidly:
FRED Graph

Stay tuned!


Monday, 20 September 2010

The end of the American Dream, the call for trade barriers and the rise in populism...

Flying an American flag upside down is not necessarily meant as political protest. The practice has its origin in a military distress signal; displaying a flag in this manner is "a signal of dire distress in instances of extreme danger to life or property".


Tyler Darden in the blog Zero Hedge, published a recent post (19th of September)courtesy of Gordon T. Long of Tipping Points. It goes through the structural and demand problems the US faces and the collapse of standard of living we are witnessing.
http://www.zerohedge.com/article/guest-post-preserve-and-protect-jaws-death


"In rent we trust"...the American dream in home ownership has been whacked. Declines in home prices have made it no more expensive to buy than rent in about half of larger markets around the US.
http://online.wsj.com/article/SB126282425648418817.html

"Thanks to falling home prices and record low mortgage rates, it now costs less to own than it has in the past decade on a mortgage-payment-to-rent basis."

http://patrick.net/housing/crash.html

"Because house prices will keep falling in most places. Prices are still dangerously high compared to incomes and rents. Banks say a safe mortgage is a maximum of 3 times the buyer's annual income with 20% downpayment. Landlords say a safe price is a maximum of 15 times the house's annual rent. Yet on the coasts, both those safety rules are still being violated. Buyers are still borrowing 6 times their income and putting only 3% down, and sellers are still asking 30 times annual rent, even after recent price declines. Renting is a cash business that proves what people can really pay based on their salary, not how much they can borrow."

"House prices do not even have to fall to cause big losses. The cost of selling a house is 6% because of the realtor lobby's corruption of US legislators. On a $300,000 house, that's $18,000 lost even if prices just stay flat. So a 4% decline in housing prices bankrupts all those with 10% equity or less."

Another interesting fact:

"There are 70 million Americans born between 1945-1960. One-third have zero retirement savings. The oldest are 64. The only money they have is equity in a house, so they must sell. This will add yet another flood of houses to the market, driving prices down even more."

Even young graduates have become disillusioned, will they be able to therefore repay their student loans?


"Student loan amount has exceeded the total credit card debts for the first time in the American history.":
The total outstanding student loan is worth 850 billion USD and the most worrying factor is that some students do not even know on how much they owe and to whom...


Negative equity have also made it difficult for their parents to recoup the educational expenses through a home equity loan...


The house is no longer an ATM in the US, the consequences of high unemployment and deleveraging is that the use of credit cards is falling very fast, and so will comsumption ultimately...


Falling houses prices, high unemployment, and negative equity have a big impact on US labor mobility:


The latest record of Gold, which to me doesn't come as a surprise, is a testimony of the policies followed by the US which is debasing their currency and therefore lowering the standard of living of the population in the process.

Because the Chinese are not letting the Yuan raise fast enough, the US authorities are now crying foul play. Their threats could have very nasty consequences, if China and the US enter a trade war.

http://www.reuters.com/article/idUSTRE68E3UF20100915

"Sander Levin, chairman of the House of Representatives Ways and Means Committee, said he would wait to hear Treasury Secretary Timothy Geithner's testimony on Thursday before he decides whether to move forward on the bill."

"The bill might violate World Trade Organization rules, draw legal retaliation against U.S. businesses and shut down trade in inputs from China that U.S. industry needs, said Camp, who represents the troubled industrial state of Michigan."

"Levin said he wants to enlist other countries to pressure China to raise the value of the yuan but he also endorsed the use of duties against Beijing's currency practices."

Another "bright" politician who has studied history and the consequences of Smoot–Hawley Tariff Act of 1930...Levin is just following the voice of Paul Krugman. I prevously posted why Paul Krugman is dangerously wrong.I concluded in the post: "It is up to the US to resolve their trade imbalances by being more competitive and to increase the amount of goods and services they export...should the US target as well Japan and Germany with higher tariffs?"

Should all the countries with trade surpluses be targeted?


The US are trying to do what they did to Japan from 1985. In 1985 the Plaza Accord was signed between Japan and the US where Japan agreed to let its yen currency appreciate against the dollar. Unfortunately for you Mr Geithner, the Chinese are not stupid and will not bow like the Japanese did and they have studied what happened to Japan, unlike American politicians...

Just the facts:

http://english.peopledaily.com.cn/200309/25/eng20030925_124911.shtml

"We all know that the rapid growth of Japanese economy after the WWII was to a large extent driven by its fast expanding foreign trade based largely on the low exchange rate of yen. Therefore, the sharp yen revaluation enforced by the "Plaza Agreement" hit badly and directly the country's foreign trade, throwing readily Japan's economy, which depended heavily on foreign resources, into a "yen revaluation depression", (that is, depression brought about by the yen revaluation). In 1986, Japan saw its total export volume shrank by 15.4 percent, real GDP growth dropped by 1 percentage point; the industrial and mining production index decreased by 0.2 percentage point and the unemployment rate broke the highest record after the war.

To shake off the depression the Japanese government and banks adopted a series of stern policies and measures. One of them was the unprecedented "financial relaxation" policy, in which Japanese banks cut interest rate for five successive times and finally fixed it at the extremely low level of 2.5 percent. Under the prevailing financial liberalization and reduced capital demand for entity economy, the large amounts of abundant funds instigated by the extremely-low interest rate swarmed to stock and real estate markets, resulting in sharp expansion of economic bubbles with stock and land prices to soar up at the core. By the end of 1989 the Nikkei average stock price had climbed to 389,000 yen, expanding two times in four years! While during 1998 alone the land price around Japan's three major metropolitans rose by 43.8 percent, the Tokyo Rim rising even by 65.3 percent.

In early 1990s, the economic bubbles created by the yen revaluation suddenly blew up, plunging the nation into an unprecedented recession, from which the country has been trying to struggle out till today. During the recession lasting longer than a decade, almost all the important economic indexes registered the worst post-war record. By then Japan had completely lost its long-term advantageous position held in the after-war pattern of western economic growth, especially that over the US. To some degree we should say, after years of efforts as set out at the "Plaza Agreement", America finally has defeated its biggest rival in the field of international trade."

The US are asking China to play Kamikaze economic policies "à la Japan".

This is the game being played by the US...So is it foul play or fool play? I will let you make your own judgement.

About the rise of populism, no surprise there:

It is gathering pace everywhere, the trend is your friend... The rise of populism is highly correlated with recession periods and severe unemployment throughout history, have a look at my previous post:

http://macronomy.blogspot.com/2010/07/i-promise-to-pay-bearer-on-demand.html

Tea Party in the US, far-right in Sweden, etc.

Populism on the rise in the Nordic region
http://euobserver.com/9/30797

The Left under siege in Europe
http://www.theaustralian.com.au/news/features/the-left-under-siege-in-europe/story-e6frg6z6-1225926399084

"Globalization is a reality. And this makes most leaders today realize that populist illusions can't be sustained before they collapse into stagnation and leave their political supporters deeply disillusioned. You can't inflate away your troubles or allow mountains of debt to build up if, as a country, you have to make your living in a globally competitive environment... Building prosperity requires caution and patience. It requires time. Populism is a short cut that doesn't work."

Fernando Henrique Cardoso, former President of the Federative Republic of Brazil for two terms from January 1, 1995 to January 1, 2003.

Monday, 17 January 2011

Are Fannie Mae and Freddie Mac on the path to a crash à la Thelma and Louise?


The tragic ending of Thelma and Louise could be similar to what awaits Fannie Mae and Freddie Mac.

http://www.thestreet.com/story/10965824/1/fannie-freddie-tough-sell-bailout-now-youre-talking.html

"Despite the fact that America's housing-finance system has cost taxpayers more money than any bank bailout and many consider its flawed structure to be the single biggest contributor to the financial crisis, it seems most people don't know how it works or care how the housing-finance problem is resolved."

"The federal government now stands behind the vast majority of mortgages in the United States, and upwards of 90% of those originated since the financial crisis took hold. The Federal Reserve still holds over $1 trillion worth of residential mortgage-backed securities (RMBS) on its balance sheet, having purchased them to increase liquidity and spur additional lending."

"Yet the very system that has kept the U.S. housing market on life support has also drained federal coffers. Fannie and Freddie have so far cost the U.S Treasury Department $150 billion, a number that may rise to $363 billion, according to the FHFA."


http://www.bloomberg.com/news/2011-01-14/how-to-fix-mortgage-mess-in-three-steps-commentary-by-laurence-kotlikoff.html

How to Fix Mortgage Mess in Three Steps: Laurence Kotlikoff:

"Fannie Mae and Freddie Mac. What cute-sounding names. They suggest adorable siblings, not twin financial disasters that may cost $1 trillion when we get the final bill.

According to Edward Pinto, Fannie Mae’s former chief credit officer, in 2008 the two government-supported mortgage finance companies, along with the Federal Housing Administration and other U.S. agencies, were holding or guaranteeing some 19 million subprime home loans, or about 70 percent of all such debt.

Much of these toxic assets, as well as many of Fannie and Freddie’s prime mortgages, aren’t performing or will likely default. Nationwide, 8 million mortgages -- or one in 10 -- are under water, with the property’s value at least 25 percent below what’s owed.

The Federal Housing Financing Agency puts Fannie and Freddie’s losses at about $300 billion. But industry experts, like Janet Tavakoli, suggest the real number is closer to $700 billion. And if home prices fall another 20 percent to return to their long-term trend, the tab might climb to $1 trillion."

I agree with Laurence's statement in relation to the sick Fannie Mae and Freddie Mac. It is time to end this very expensive joke, once and for all.

The US government has no place in the mortgage business. Look at how the mortgage business has been managed in Denmark for a clue on how a sound mortgage system work.

The first Danish Mortgage Act was passed in 1850. Issued mortgage loans have a maximum loan to value (LTV) of 80% for residential properties.

http://www.globalpropertyguide.com/Europe/Denmark/Price-History

"To fund the loan, banks issue mortgage bonds. The strict legal framework of the “balance principle” requires mortgage bonds to match the value and terms of the corresponding mortgage loan the bank is funding. The framework has provisions limiting the currency, interest, and liquidity risks of bonds. The strict regulations of the mortgage market limit the risks shared between bond-holders and mortgage institutions, create transparency, and offer investors security. This helps the continued growth of the mortgage market despite tough macroeconomic conditions."

"A due on sale clause in a loan contract means that borrowers have to pay their loans in the event the property has to be sold. This clause isn’t attached in Danish mortgage loan contracts, as borrowers can transfer the remaining loan to the new owner, or can buy back the bonds. This is especially beneficial to borrowers who experience situations where house sales are involved.

This payment system discourages borrowers from defaulting their loans, as they remain liable for the payment of their loan if they default."

For more on the subject relating to the Danish system:

http://www.economist.com/node/12855447

http://www.bloomberg.com/news/2010-12-12/danish-top-rated-mortgage-debt-draws-investors-fleeing-crisis.html

Fact:
"Denmark’s mortgage bonds haven’t suffered a default since they were introduced after the great Copenhagen fire of 1795."

Fannie and Freddie were set up in 1968 and 1970. The question that need to be adressed by January 31st is the following: "What is the appropriate role of the government in the housing market?" The Dodd-Frank reform bill required the Treasury Department to issue a comprehensive proposal to Congress.

Tim Rood, a former Fannie Mae official, compares the idea of relinquishing federal support to going cold turkey off of a powerful drug:

http://www.thestreet.com/story/10965824/5/fannie-freddie-tough-sell-bailout-now-youre-talking.html
"You see some folks trying to draw the analogy between markets like Canada which have never had any government support or backing for the mortgage market and which seems to have achieved - on a much smaller scale - the nirvana of housing in homeownership rates, perfect matching of interest rate risks and all that," says Rood, who's now a managing director at D.C. consulting firm The Collingwood Group. "But it's like trying to compare an Amish baker to Keith Richards. There's no policy equivalent to methadone. We've been on it forever - you can't just say 'Look how easy it is to live without government involvement or backing of the mortgage market.' It's just not an easy thing to undo."

The answer is to privatize the system, following a Danish approach to mortgage financing:

"Affordable housing doesn't have to mean that everyone has to own a home. It's still a great dream and everyone should still aspire, if they choose to, to own a home. But when it comes to the government fostering 'affordable housing,' that might be rental housing."
says Edward Kramer, a former banker and regulator who is now a consultant at Wolters Kluwer.

Below is what George Soros has to say about the Danish system and reforming the US mortgage market in 2008. The problems of the US mortgage market are yet to be addressed.

Soros: Denmark Offers a Model Mortgage Market
There is a safe way to securitize home loans.

By George Soros

"The American system of mortgage financing is broken and needs a total overhaul. Until there is a raealistic prospect of stabilizing housing prices, the value of mortgage-related securities will erode and Treasury Secretary Henry Paulson's efforts will come to naught. There are four fundamental problems with our current system of mortgage financing.

First, the business model of Government Sponsored Entities (GSEs) in which profits accrue to the private sector but risks are underwritten by the public has proven unworkable. It would be a grave mistake to preserve the GSEs in anything resembling their current form.

Second, the American style of mortgage securitization is rife with conflicts where entities that originate, securitize and service mortgages are generally not the same as those that invest in mortgage securities. As a result, the incentives to originate sound mortgages and to service them well are inadequate. No wonder that the quality of mortgages degenerated so rapidly.

Third, mortgage-backed securitizations, which were meant to reduce risk by creating geographically diversified pools of mortgages, actually increased risk by creating complex capital structures that impede the modification of mortgages in the case of default.

Finally, and most fundamentally, the American mortgages market is asymmetric. When interest rates fall and house prices rise, mortgages can be refinanced at par value, generating the mortgage equity withdrawals that fueled the housing bubble. However, when interest rates rise and house prices fall, mortgages can only be refinanced at par value even though the market price of the securitized mortgage has fallen.

To reconstruct our mortgage system on a sounder basis, we ought to look to the Danish model, which has withstood many tests since it was brought into existence after the great fire of Copenhagen in 1795. It remains the best performing in Europe during the current crisis. First, it is an open system in which all mortgage originators can participate on equal terms as long as they meet the rigorous regulatory requirements.
There are no GSEs enjoying a quasimonopolistic position.

Second, mortgage originators are required to retain credit risk and to perform the servicing functions, thereby properly aligning the incentives. Third, the mortgage is funded by the issuance of standardized bonds, creating a large and liquid market. Indeed, the spread on Danish mortgage bonds is similar to the option-adjusted spread on bonds issued by the GSEs, although they carry no implicit government guarantees.

Finally, the asymmetric nature of American mortgages is replaced by what the Danes call the Principle of Balance. Every mortgage is instantly converted into a security of the same amount and the two remain interchangeable at all times. Homeowners can retire mortgages not only by paying them off, but also by buying an equivalent face amount of bonds at market price. Because the value of homes and the associated mortgage bonds tend to move in the same direction, homeowners should not end up with negative equity in their homes.

To state it more clearly, as home prices decline, the amount that a homeowner must spend to retire his mortgage decreases because he can buy the bonds at lower prices. The U.S. can emulate the Danish system with surprisingly few modifications from our current practices. What is required is transparent, standardized securities which create large and fungible pools. Today in the U.S., over half of all mortgages are securitized by Ginnie Mae, which issues standardized securities. All that is missing is allowing the borrowers to redeem their mortgages at the lower of par or market.

Because of the current havoc in the mortgage market, there is no confidence in the origination and securitization process. As a result, a government guarantee is indispensable at this time, and may be needed for the next few years. As the private sector regains its strength, the government guarantees could, and should, be gradually phased out.

How to get there from here? It will involve modifying the existing stock of mortgages, so that the principal does not exceed the current market value of the houses, and refinancing them with Danish-style loans. The modification will have to be done by servicing companies that need to be properly incentivized. Modifying mortgages that have been sliced and diced into securitizations may require legislative authorization. The virtual monopoly of the GSEs would be terminated and they would be liquidated over time.

A plan to reorganize the mortgage industry along these lines would inspire the confidence that would allow a successful recapitalization of the banking system with the help of the $700 billion package approved last week."

Mr. Soros is chairman of Soros Fund Management and the author of The New Paradigm for Financial Markets (Public Affairs, 2008).

For an additional essay from George Soros on the subject please see below:

http://www.georgesoros.com/articles-essays/entry/reforming_a_broken_mortgage_system1/

Both GSEs Fannie and Freddie have been held in federal conservatorship since September 2008 and have received roughly 134 billion USD in taxpayer money to stay afloat so far...

US Home Ownership from 1980 until 2010:

The End of the American Dream:


The current S&P Case Schiller index 20-City Home Price Index:


Ben Bernanke is well aware of the issue with both GSEs. There cannot be a sutained recovery in the housing market before the Obama administration releases its recommendations for the future of Fannie Mae and Freddie Mac.
The dominance of the GSEs in mortgage finance needs to be reduced.

It is up to the US Congress to work on a solution. Let's hope the the Treasury Department issue a comprehensive and intelligent proposal to Congress before the 31st of January.

Thursday, 17 March 2011

Fool me once, shame on you; fool me twice, shame on me...

My thoughts are with all the Japanese people following the ongoing tragedy.
"神さまが守るように"
"kami sama ga mamoru youni"
"May God protect you."

"Japan is a very rich country and has a high savings rate and has the capacity to deal not just with the humanitarian challenge but also the reconstruction challenge they face ahead."

US Treasury Secretary Tim Geithner
Tuesday 15th of March 2011.

Geithner does not believe that there is a risk Japan could sell their US Treasuries to raise cash in order to respond to the damages caused by both the earthquake and the tsunami.

And the reason why according to US Treasury Secretary is that "Japan has a high savings rate":


Japanese getting older = Bad for savings Tim...

Yeah right Tim! Spot on!
This is purely and simply incorrect to stay polite. Get your facts right...I am not surprised to hear this from the man who was in charged of regulating the US banks while at the New-York Federal Reserve Bank from 2003 until 2009.

Are we witnessing at this very moment the demise of the US dollar?

Japan might be finally calling another bluff from the US by dumping in size their US Treasuries to rebuild their economy.

I previously wrote about the Bluff Call of 1971 - the Nixon shock and the collapse of the Gold Standard.

Is it payback time for Japan following the disaster of the 1985 Plaza agreements? (please refer to the post: Analyze this!).
As a reminder from my previous post, another former quote from Tim Geithner:

"On June 1, 2009, during a question-and-answer session following a speech at Peking University, Geithner was asked by a student whether Chinese investments in U.S. Treasury debt were safe. His reply that they were "very safe" drew laughter from the audience."

China is not stupid. I wrote specifically on the fact that China is well aware of what happened to Japan with the Plaza Agreements of 1985: The end of the American Dream, the call for trade barriers and the rise in populism....

Please find enclosed the link to the Chinese view on what happened to Japan following Plaza in 1985:

Revaluation of Japanese Yen, a historical lesson to draw: analysis

Maybe Japan has no choice but to cash in on its holdings to rebuild its country and repatriate Japanese Yens. At least this is what the FX market is betting on, given this evening huge price action and surge in JPY versus the USD from around 80 to an amazing 76 JPY for one USD to now back to 79...Crazy...


Japan selling their US Treasuries would be driving up interest rates.

Prior to the dramatic events happening in Japan, Bill Gross, from PIMCO, the authority on bonds, announced to the world he had dumped all his US Treasuries from his flagship fund: “Yields may have to go higher, maybe even much higher to attract buying interest,”
Yes, Bill Gross expects a sharp increase in interest rates within the next few months. If Japan starts dumping some of its US Treasuries holdings (around 885.9 billions USD as of January 2011), you can be assured Bill's expectations could materialise. China cut its holdings of US treasury bonds by 5.4 billion USD to 1.15 trillion USD in January, reported sina.com.cn, citing the U.S. Department of Treasury.

During the 1995 Kobe earthquake, the Japanese repatriated 30 billion USD worth of U.S. government bonds, equivalent to about 13 per cent of its Treasury holdings at the time.

This time is different?

Wednesday, 23 March 2011

"the more it changes, the more it's the same thing" - Review of the ongoing economic issues

"plus ça change, plus c'est la même chose"—"

Jean-Baptiste Alphonse Karr (November 24, 1808 – September 29, 1890)
French critic, journalist, and novelist.

Ireland 10 year bonds are trading now north of 10% for the first time since December 1992.
As I previously posted, we are in a time machine and just made a quick trip to the past:

European Government Bonds - Back to the Future?
"From 1991 until 2010 Ireland's Government Bond Yield for 10 Year Notes averaged 5.72 percent reaching an historical high of 10.47 percent in December of 1992 and a record low of 3.06 percent in September of 2005."


The yield on Ireland’s two-year securities rose 57 basis points to 10.44 percent. The 10-year yield exceeded 10 percent for the first time since the euro was introduced in 1999.

The problems is that the Irish financial sector troubles are just too big now for the Irish Government to cope with.

According to a recent article in Bloomberg by Joe Brennan published on March 18, "Ireland Said to Weigh Allowing Banks to Set Up Asset Warehouse"
Ireland is finally giving in setting up an Irish "Resolution Trust Corporation".
Joe Brennan commented:

"Irish authorities are considering allowing the country’s debt-laden lenders to set up a company to warehouse more than 60 billion euros ($84.8 billion) of loans that would be wound down or sold over time, according to three people familiar with the matter."

The reality behind this move is that the deposit outflows experienced by Irish banks since last year is making them increasingly dependant on funding from the ECB.
From the same article:
"Irish central bank Governor Patrick Honohan said the ECB wanted to accelerate deleveraging, Ireland has “put in the condition of no fire-sale losses because the state cannot afford it,” he said."

On the 31st of March we will get the results from the capital and liquidity stress tests on Irish Banks.

Joe Brennan added:
"So-called viable lenders, including Bank of Ireland Plc, Allied Irish Banks Plc (ALBK), Irish Life & Permanent Plc and EBS Building Society, need to cut their loan-to-deposit ratios to 122.5 percent, “which is acceptable to Europe,” Finance Minister Michael Noonan said March 14. The average loan-to-deposit ratio is currently about 170 percent."

From TBTF (Too Big To Fail) to TBTB (Too Big To Bail)...

Joe Brennan also indicated in Bloomberg news the following sobering fact:
"Irish Credit Bureau Chief Executive Officer Seamus O’Tighearnaigh said that 9.5 percent of loans registered with the company are at least one month in arrears, up from 0.75 percent in 2006, the Sunday Times reported."

The example of Ireland clearly showed the issue, where Ireland's public finances were put in disarray due to the massive bail out need of its financial sector (please see previous posts on that subject: The European Vortex, The Irish Black Hole, Ireland in the need of a lucky Shamrock).

5 years CDS on Portugal stands at 536 bps and Ireland 5 years CDS increased by eight basis points to a seven-week high of 625 bps, according to CMA.

Portugal's government as well is collapsing, given parliament is not willing to bite the bullet and to accept the latest austerity measures proposed by the government. Another EU member bites the dust as I type this latest post. You can expect another bumpy ride in the Eurozone.

The housing hangover issues are still the biggest problems plaguing not only the Irish economy but the US economy as well.

U.S. New-Home Sales fell to the lowest level on record:


Yes indeed, the more it changes, the more it stays the same...

Bank of America CEO Brian T. Moynihan said:
"The problem of delinquent mortgages and falling home values is the most stubborn, entrenched and damaging economic problem our country faces today."
Bank of America's CEO is correct. I touched on the subject of the impact of real estate on the US economy in my post "Extend and Pretend" - Banks bloated balance sheets and the Impact of Real Estate crisis.

January home prices in the U.S. fell 0.3 percent from December, according to the Federal Housing Finance Agency. Prices nationwide fell 3.9 percent in the 12 months ended in January.

So big is the issue that Bank of America had to segregate almost half of its mortgages Into ‘Bad Bank’ according to Bloomberg report from Dawn Kopecki published on the 8th of March:

"The legacy portfolio will hold 6.7 million loans with outstanding principal balance of about $1 trillion."

"Of the 13.9 million loans Bank of America services, about 3.5 million are held by the company on its balance sheet. The rest are owned by other investors."

Reminder:
"Bank of America services 14 million mortgages, or one out of every five in the U.S., and its loan-servicing portfolio exceeds $2.1 trillion in size. Of its mortgages, 10 million came from its 2008 acquisition of troubled California lender Countrywide Financial Corp. More than 80% of its delinquent loans were acquired through Countrywide."

Bank of America is also actively selling its exposure to commercial real estate:
BofA Is a ‘Very Active’ Seller of Commercial Real Estate to Limit Losses
The US Treasury is as well reducing its portfolio of Mortgage Backed Securities, looking at selling 142 billion USD worth of MBS guaranteed by Fannie Mae and Freddie Mac at the tune of 10 billion per month.

As I wrote in "Resolution Trust Corporation II - the unavoidable Sequel", 1 out of 4 US Household is already in negative equity, "Desperate times need decisive action and setting up a new RTC would definitely be the right move in the right direction".

For more on the difficult situation for the US economy and the impact of households in negative equity please look at the following post:

The end of the American Dream, the call for trade barriers and the rise in populism...

So far 25 banks failed in the US in 2011. 157 banks failed in 2010 according to FDIC. Increasing loan losses on commercial real estate are expected to result in hundreds of bank failures in the coming years.
The Unofficial Problem Bank list on the 19th of March stands at 982 institutions with assets of 430.4 billion USD, up from 964 institutions with assets of 420.7 billion USD as per the excellent CalculatedRisk blog.

For Robert Burney, a banking and finance professor at Coastal Carolina University:
"It's a race between deteriorating portfolios and recovering economies,"
Read more: http://www.thesunnews.com/2011/03/20/2047287/undercapitalized-banks-struggling.html#ixzz1HRrvO1fK

The US need more job creation but negative equity weights heavily on job mobility:
Non Farm Payrolls from 1992 onwards.

At the same time inflation in the UK keeps creeping up, no surprise there. It was expected previously on numerous posts on this blog.

UK inflation from January 1989 until March 2011:

Mervyn King at the Bank of England doesn't seem to be able to keep the ink dry, yet another letter to the Chancellor.

The Bank of England purchased around 165 billion GBP of assets by September 2009 and around 175 GBP billion of assets by end of October 2010.


Any coincidence with the rise in inflation in the UK is of course purely fortuitous given QE started in March 2009...

As a reminder of the risk of QE:
"Quantitative easing may cause higher inflation than desired if it is improperly used, and too much money is created. It can fail if banks are still reluctant to lend money to small business and households in order to spur demands. Quantitative easing can effectively ease the process of deleveraging as it lowers yields. But in the context of a global economy, lower interest rates may contribute to asset bubbles in other economies."

Consumer confidence in the UK is still at the lower end:
January 1992 - March 2011

Are we seeing asset bubbles in other economies? China? Brasil? Etc.
Most certainly. QE is exporting inflation first in emerging markets then back to developped countries:

Both the UK economy and the US economy are in "The Hurt Locker".

As a reminder from previous post The Endgame - Fin de partie:

Inflation, Not Deflation, Mr. Bernanke
By Andy Xie 08.16.2010 18:12

http://english.caing.com/2010-08-16/100171139.html
"The globalization reality is that developed economies like Europe, Japan, and the U.S. will suffer slow growth and high unemployment. Stimulus is the wrong medicine for solving problems. Believing this will lead to excessive stimulus, which causes inflation and bubbles in emerging economies first and inflation in developed economies later. The wrong policy prescription pushes the global economy through unnecessary gyrations, stagflation and possibly another major financial crisis in the emerging economies. It's high time for Mr. Bernanke to wake up from his stimulus obsession."

Can we expect QE3?

Saturday, 30 July 2011

Is the policy of achieving a high home ownership rate the biggest threat for an economy?

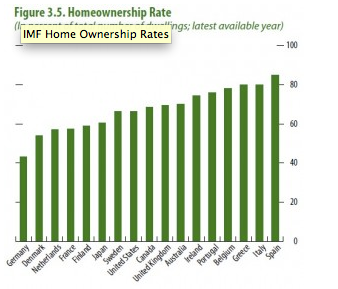
Is there a correlation with current sovereign issues with the homeownership rate? As one can see from the graph below, countries in Europe with the highest homeownership rate are currently countries facing the most pressure.


Source "naked capitalism" blog.

Ireland, Greece, Portugal, Spain and Italy, all have very high home ownership rates.
All of these are currently experiencing tremendous pressure on their sovereign spreads.

The issue with enticing a high home ownership rate is the level of household debt it generates as illustrated by the McKinsey report published in January 2010. A must read.

Household leverage measured as debt/income increased the most during the the housing credit fuelled bubble:

Most of the growth in debt was not in the financial sector during the credit bubble according to McKinsey:

The growth in lending was concentrated in residential mortgages as highlighted by McKinsey's study.

The cost of enticing home ownership in the UK is all very clear in the below graph:

Finally the sectoral composition of debt differs across economies:

In a previous post "Extend and Pretend" - Banks bloated balance sheets and the Impact of Real Estate crisis, I mentioned the following:

"Property is widely seen as a safe asset. It is arguably the most dangerous of all, says Andrew Palmer"

It can be argued that the most toxic of all bubbles is a housing/property bubble. They also always generate a financial crisis when they burst due to the leverage at play. How the risk can be mitigated? By forcing players to have more skin in the game.
Recently Sweden passed a law limitating the maximum Loan to Value (LTV) to 85%. In effect, Swedish people will need to put down a minimum of 15% of deposits to borrow 85% of the remainder.

Historically, in the US home ownership levels have been between 63% and 66% since the 1950s, only recently US home ownership has spiked to nearly 70% because of the credit bubble and its ultimate bust. What is currently happening with continuing falling prices in US house prices is a simple reverse to the mean. Everyone expects rising rents and declining apartment-vacancy rates to give housing market a welcome boost. Although buying in the US appears now more affordable, and 30 years fixed-rate mortgages have reached very low levels, given the current glut of vacant homes, where have not reached that point yet. Also, when reversing to the mean, markets often tends to overshoot. About 10% of 130 million homes in the US remain empty.

In Germany, historically, home ownership is notoriously lower. It was 43% in 2008. UK and the US were at the same level in 2008-2009, around 70%.
Germany's low home ownership rate stems from various factors, weaker population growth, very strong tenant rights, as well very heavily regulated mortgage market.

How Germany Achieved Stable and Affordable Housing - from the blog "naked capitalism".

Here is an extract of the conclusion of the article comparing the UK and German home ownership rate:

"The contrast between the German and UK housing markets couldn’t be more stark.

Unlike Germany, the UK housing market is essentially a bubble factory. Wheras Germany’s highly responsive supply ensures that extra demand manifests itself in rising new home construction rather than increased prices, the opposite is the case under the UK’s restrictive land-use policies.

The UK’s deregulated rental market and lack of tenure has also ensured that renting is a second rate option, thereby encouraging residents to strive (and borrow big) for owner occupancy. And of course the UK’s lax financial system has been only too happy to oblige, providing households with no deposit mortgages during the boom followed by rationed credit during the bust.

When all these factors are combined, is there any wonder why Germany’s home prices have remained stable and affordable, and free of the speculative behaviour, ’panic buying’ , and price volatility inherent in the UK system?

It’s a shame that Australia has inadvertently adopted the worst aspects of the UK housing market, namely: the UK-style planning system, complete with similar vertical fiscal imbalances with respect to federal, state and local taxation revenues; a deregulated rental market offering insecure tenure; and a deregulated mortgage market that provides low deposit finance at generous multiples of income."

Australia is facing the same issues relating to its housing market as the UK have been facing.

But in addition to the author of the post's conclusion, German banks opt to lend money first to its industries before housing, and it does make a very big difference in the economic growth and competitiveness between the UK economy and German economy. A lower ownership rate in Germany has been beneficial in reducing the impact of the economic recession and the speed of the bounce back as shown in the below graph relating to German GDP growth:
Germany GDP Annual Growth Rate
and the UK GDP growth during the same period:
United Kingdom GDP Growth Rate

The credit crunch has caused a massive surge in UK and US unemployment. In times of economic expansion, countries like Germany doesn't reap the benefit of a strong and booming real estate market. But a government adopting a cautious stance in relation to home ownership rate in conjunction with stronger regulation and countercyclical measures such as the ones which have been successfully implemented in Canada (see previous post relating to Canada), will have more stability in times of economic recession.

One could argue, that home ownership should not be recklessly encouraged by politicians as it does appear to be a "Weapon of Economic Destruction" (WED). If people are struggling to raise large deposits required to secure a mortage, should the government encourage them to leverage too far in the first place? The recent credit bubble burst in the US and the subprime debacle, highlights the dangerous results in the incestual relationship between politicians and banks, and the promotion of the "American Dream" at all cost.

End of the day, falling house prices, high unemployment and negative equity have a big impact on US labor mobility in particular and the US economy in general.


Monday, 5 February 2018

Macro and Credit - A shot across the bows

"History is a vast early warning system." - Norman Cousins, American author


Looking at the markets wobbles on Friday, with the ructions taking place in various asset classes with continued pressure on bonds, there were nowhere to hide except maybe cash in US dollar, so we reminded ourselves for our title analogy of the phrase "A shot across the bows" given our fondness for maritime analogies. Admiral William Smyth, the author of the 1865 book "The sailor's word-book: an alphabetical digest of nautical terms, defines the bows as follows:
"The fore-end of a ship or boat; being the rounding part of a vessel forward, beginning on both sides where the planks arch inwards, and terminating where they close, at the rabbet of the stem or prow, being larboard or starboard from that division". 
"A shot across the bows" derives from the naval practice of firing a cannon shot across the bows of an opponent's ship to show them that you are prepared to do battle. But, the more general figurative use of the expression, just to mean warning. During the 18th century, a warning shot (in nautical terms, called "a shot across the bow") could be fired towards any ship whose "colours" (nationality) had to be ascertained. According to the law of the sea, a ship thus hailed had to fly her flag and confirm it with a gunshot. The latest nonfarm payroll number with U.S. Average Hourly Earnings rising 2.9% Y/Y, the most since 2009 against expectations could be perceived as the shot across the market bows we think as the markets are starting to feel the threat of inflation expectations building up which would mean a more aggressive hiking stance from the Fed. After all the last time stocks and bonds moved in the same direction to this extent was in August 2015 after Chinese policymakers devalued the yuan. On this very blog we warned in numerous conversations about the risk for "balanced funds" getting "unbalanced" due to rising positive correlations thanks to central banks meddling with volatility and interest rates. At the end of August 2016, we were reminded how stocks and treasuries could move together. We had the same pattern following the surprise Chinese Yuan devaluation in August 2015 as well. The correlation between stocks and bonds has been increasing as stocks have been driven more and more by the chase for yield, that simple. In this repeated scenario we saw on Friday, the diversification benefits of a traditional 60/40 (stocks/bonds) portfolio disappears, yet another shot across the bows, as in 2015 and 2016. 


In this week's conversation, we would like to look at the recent sell-off thanks to rising positive correlations rendering once again balanced funds unbalanced. Instability thanks to rising positive correlations have been brewing in recent years. We have discussed this problem in numerous conversations (as pointed out in our short August 2016 conversation "Positive correlations and large Standard Deviation moves").


Synopsis:
  • Macro and Credit - Is the luck of "balanced fund managers" about to run out?
  • Final charts - The "Wealth" defect


  • Macro and Credit - Is the luck of "balanced fund managers" about to run out?
Back in February 2016 in our conversation "The disappearance of MS München" in which at the time we said we were writing for posterity and tackling in depth various aspects of risk including the inadequacy of VaR (Value at Risk) as a risk measurement tool, we argued the following:
"Rising positive correlations are rendering "balanced funds" unbalanced and as a consequence models such as VaR are becoming threatened by sudden rise in non-linearity as it assumes normal markets. The rise in correlations is a direct threat to diversification, particularly as we move towards a NIRP world:
"When it comes to a macro-driven market as "central banks' put" are losing their "magic", correlations unfortunately are still moving higher, which, we think is a sign of great instability brewing. The correlation between macro variables such as bund yields, FX and oil and equity market factors (Momentum, Value, Growth, Risk) is now higher than the correlation between macro variables and the market. There lies the crux of central banks interventions. There is now deeper inter-linkages in the macro economy as well as financial markets globally post crisis." - source Macronomics, January 2016
Once again, the correlation between macro variables in recent months have gone in concert significantly in recent months as highlighted by Deutsche Bank in their Asset Allocation note from the 31st of January entitled "Stretched Consensus Positioning":
"Has the fever broken?
Whatever the fundamental case for each of these trades, extended positioning argues at a minimum for a breather and more likely a pullback soon. Moreover, the tight correlation in the moves across the major asset classes (oil up, dollar down, equities and bond yields up) suggests a pullback in one for idiosyncratic reasons would likely spill over to the others. There are several potential fundamental catalysts for a positioning unwind although cases of extended positioning do not always require one:
■ Oil looks most vulnerable from the vantage point of positioning. While it has been supported by a series of positive factors, a turn in any, especially a lagged increase in supply as is typical after periods of rising oil prices, risks a sharp positioning unwind.
■ A rise in the dollar has potentially the widest fundamental impact across asset classes. Arguably its depreciation has been an important driver of the run up in oil prices to which breakeven inflation and bond yields have been well correlated. The decline in the dollar and higher oil prices have been a significant positive for equities but in our view not the most important as the drivers of the rebound in earnings have been very broad based (Very Strong Earnings Growth Before Tax Reform, Jan 2017).
■ Equities while vulnerable to a positioning unwind have seen very little in terms of inflows. Recent inflows look largely to be a catch up for prior outflows. In particular US equities have seen almost no inflows cumulatively since the start of the 15-month rally.
■ Short positioning in rates is at an extreme and vulnerable to a pullback but bond valuations remain in our view completely out of line with growth, reflecting weak inflation which we expect to turn up. If inflation fails to pick up, the large short positions are likely to be unwound and rates turn lower in turn, as happened last year. Our house view remains a gradual rise in inflation which supports the large short positions and would allow for a continued orderly rise in rates. This will have implications in our view mainly for the bond market which has enjoyed the bulk of inflows through the cycle and to which end investors remain massively over allocated. However the risk is that with all 4 fundamental drivers of inflation pointing up, a move in concert has the potential to create a sharp pickup in inflation which is likely to be interpreted as a sign of the economy overheating and the Fed embarking on hiking until it ends the cycle, resulting in broad based risk aversion." - source Deutsche Bank

Positive cross-asset correlation  and balanced funds getting "unbalanced" is a subject we discussed in our May 2015 conversation "Cushing's syndrome". We quoted  Louis Capital Markets Cross Asset Weekly report from the 20th of April entitled "No more safety net" at the time:
In a ZIRP world plagued by rising positive correlations, we would argue that the luck of "balanced fund managers" is about to run out. We quoted  Louis Capital Markets Cross Asset Weekly report from the 20th of April entitled "No more safety net" at the time: 
"Buying uncorrelated assets will lower the volatility of a portfolio without diluting it to the same extent as the expected return. In a context of price stability, the bond asset class was the perfect diversifying asset for equities as long as equities were driven by the economic cycle. The problem of this market cycle is that the necessary hypotheses for this negative bond-equity correlation have disappeared. Monetary authorities have not managed to restore price stability in the developed world and economic growth is lower than before. As a consequence, the stubborn actions of central banks have distorted the pricing of bonds and they have therefore lost their sensitivity to the business cycle." - Louis Capital Markets
Arguably rising positive correlations and repressed volatility are we think, recipe for large trouble ahead. In similar fashion to CPPI strategies, Vol Control funds (representing close to $200 billion) must decrease leverage to protect principal hence the dangerous feed-back loop for these strategies increasingly at risk from rising cross-asset correlations with reduced buffer from the bond allocations in some case such as the much vaunted stars of the last decade aka "balanced funds". Vol control products sell equities when volatility is rising and buy equities when volatility is falling, creating a market feedback loop.

In our "investing book", these strategies are indeed directly impacted by the rise of "positive correlations". On the subject of "Risk Parity Strategies" we would like to redirect you dear readers to the guest post from our Rcube friends which we published on the 14 August 2013 entitled "Is Risk Parity a Scam":
"Because risk parity strategies always overweigh fixed income assets due to their low volatility, we can ascertain that this source of outperformance against conventional 60/40 allocations has dried up, even without invoking a big rotation that would bring 10-year yields back to a theoretical long-term equilibrium value.
According to the risk parity playbook, an investor should therefore increase his exposure to Treasuries alongside the Fed. In exchange for a minuscule return, the investor would, thus, face a substantial jump risk if the Fed had to apply a hurried “exit strategy” due to a surge in inflation…
From a broader perspective, we consider risk parity to be the antithesis of Minsky’s “financial instability hypothesis”. According to this view, investors increase their leverage when they believe an asset to be stable, which reinforces their belief that the asset is, indeed, stable (this is a perfect description of how risk parity investors behave in a given asset class). The cycle goes on until we reach the dreadful “Minsky moment”, where investors are forced to deleverage as the real risk of the asset reveals itself."
Conclusion
Due to the fall in government yields over the last 30 years, risk parity strategies have had an easy time compared to traditional asset allocations. We should therefore disregard all the performance based arguments that are often put forward by the proponents of risk parity.
From a conceptual standpoint, although it might seem unfair to make generalizations about a strategy that exists in many different variants and implementations, we believe that risk parity suffers from many structural flaws:
1) Risk parity requires to make choices between many different implementation options, asset selection, calculation parameters etc. These choices necessarily contain arbitrary components and will have a significant impact on the strategy's performance under different scenarios.
2) By placing diversification above any other consideration, risk parity portfolios can hold assets at (or even move assets toward) uneconomic prices. This problem is magnified as risk parity - or other approaches focused on diversification - become increasingly popular.
3) After all, risk parity’s quest for diversification might prove fruitless, as risk parity portfolios end up harvesting the same basic risk premia as traditional asset allocation (mostly the equity premium and the term premium), albeit at different dosages.
4) The leverage used by risk parity strategies makes them prone to deleveraging and, therefore, to crystallization of losses.
5) Risk parity’s false premise that risk can be quantified as a single number exposes it to highly asymmetric returns, which can happen to any asset class given the right set of circumstances.
If someone wants to run a passive asset allocation, we therefore believe that a market portfolio constitutes a better option from many perspectives: conceptual, foreseeable reward-to-risk and CYA.
For the same reasons, we strongly reject the idea that risk parity portfolios could represent an "all weather", quasi-absolute return strategy (we suspect marketing departments are the ones to blame for these outlandish claims).
There are certainly seasoned risk parity professionals out there who are able to mitigate risk parity's numerous flaws.
However, we have little doubt that when the next "black swan" terrorizes the financial world (as seems to be the case on an increasingly frequent basis), we will witness the implosion of many risk parity strategies (those that are based on high leverage, overly simplistic assumptions on asset risks, and/or an unfortunate choice of underlying assets). Trusting risk parity to manage one's life savings is therefore quite perilous, especially if it takes the form of a formula-based risk parity ETF - which should come out any day now.-"Is Risk Parity a Scam", August 2013
We still could not agree more with our friends. This risk is still valid today and it got even more "crowded" in recent years.  One should always pay great attention to rising positive correlations as they portend some pull-back eventually with no one truly spared. 

When it comes to market jitters and flows, the High Yield ETF crowd, mostly made up of retail players continue to be feeble when it comes to exiting the party when the heat is on. Bank of America Merrill Lynch in their High Yield Flow report from the 1st of February 2018 entitled "HY outflows accelerate" continues to point towards the nervousness of the retail crowd:

"US HY sees large outflow, EM debt and high grade gain
Outflows from US HY funds totaled $1.39bn (-0.6%) last week, accelerating from $838mn and $938mn during the previous two sessions, respectively. Most of the outflows continue to be concentrated in ETFs which experienced a $1.02bn (-2.1%) redemption last week, whereas open-ended funds recognized a $375mn (-0.2%) withdrawal. These most recent outflows completely wiped out the $3bn in gains during the first two weeks of the year, sending the YTD total to -$188mn. HY funds domiciled outside the US continued to see moderate outflows as well with a $1.3bn (-0.4%) redemption last week. Because the majority of these funds still invest in USD debt, these outflows amplify the selling pressure in the secondary USD HY market. January’s 34bps spread tightening and +0.64% total return is even more impressive when viewed in this context.
 - source Bank of America Merrill Lynch

Could the current trend in continuous outflows start in earnest biting credit spreads in the High Yield space? This is an important question from an allocation perspective for the yield hungry crowd. On that subject we read with interest Barclays take in their US High Yield note from the 2nd of February entitled "Stumble and a Trip over Treasuries":

"High yield spreads have continued to rally through their 2014 tights even in the face of a pickup in supply and persistent outflows, with the 24 bp spread tightening year-to-date through Wednesday almost offsetting the 31 bp increase in 5y rates in January. As discussed in Fuller Cushions In Lower Quality, the ability of spreads to absorb rates is diminished when spreads have been at similar levels. And while markets have largely shrugged off weakening technicals, we take a more cautious near-term and tactical view considering tight valuations and the potential for further outflows driven by large adverse rate moves.
As noted in Temporary Relief from Rate Fears, outflows alone are typically not a catalyst for prolonged spread widening and particular pressure on returns. The recent experience has followed that playbook, and cumulative outflows of $23 bn over the past 12 months have done little to derail cumulative total return of 6.6% over the same period of generally stable or improving macro trends. But looking further back, episodes such as the "taper tantrum" suggest that the opposite can occur. Over the one-month period following the 34bp flare-up in 5y rates in May 2013, high yield mutual funds endured outflows of more than $8.5 bn and the High Yield Index widened by more than 50bp. We do not anticipate a similar response, but believe that this could be indicative of the direction of fund flows, if not the magnitude.
To examine the relationship between rate moves and flows in and out of high yield mutual funds more closely, we rank monthly moves in 5y rates by decile in rate rising environments and look at the average mutual fund flow as a percent of total AUM the following month. When considering all spread environments. Figure 1 shows that outflows tend not to materialize even when rates increase by more than 30bp, as they have recently.

But restricting our analysis to months when the high yield market has started tighter than 450bp (approximately the long-term average, excluding the financial crisis), shows a clearer relationship: the sharper the rate move, the larger the outflow (Figure 2).

The last two deciles, in particular, seem relevant today given a similar-sized increase in Treasury yields over the past several weeks.
The recent divergence between flows and returns, particularly stark in 2017 (Figure 3), warrants further analysis of whether rate moves and associated outflows can be a drag on total returns.

We thus tweak the analysis above to examine how High Yield Index returns vary with changes in rate movements in both normal and tight spreads environments. Two things stand out:
  • When considering the full history of spread environments, increases in Treasury yields typically do not weigh on returns. Figure 4 shows no clear relationship between changes in 5y Treasury yields and one-month-forward total returns, largely in keeping with the results of Figure 1, which shows the ensuing fund flows.

  • But in tight spread environments, adverse rate movements can affect the near-term performance of the High Yield Index. The inflection point beyond which returns are dragged down by rate movements appears to be around 23bp. Past that threshold, rate moves have, on average tended to produce negative returns for high yield credit in the next month (Figure 5).

The findings in Figure 5, particularly the negative high yield total returns after month of large moves in Treasury yields in tight spread environments, are logical and intuitive. Carry in tighter spread environments is not able to offset the drag on total returns produced by large increases in base yields. But we think this is amplified by our findings that escalation in Treasury yields similar to those seen year-to-date have historically preceded larger-than-average outflows from high yield mutual funds the following month. Finally last week, in Vol Hunting Heading into Earnings, we noted that there is historical evidence to support a pause or outright reversal in spreads during earnings seasons in similar tight spread environments. All of these data suggest near-term caution toward the high yield asset class" - source Barclays.
As a reminder, the greater the volatility, the greater the disadvantage of owing negative convexity bonds like you find in the High Yield space. In the current low yield environment, both duration and convexity are higher, therefore the price movement lower can be larger. Pretty simple. Therefore we are not surprised by Barclays take on the feedback loop we can have between higher rates and outflows for US High Yields in a very tight spread environment. Things can indeed turn "South" rapidly, regardless of how feeble the retail investment crowd is in the ETF sector.

Given the change in the narrative of the Fed and it's continuing hiking path and the fear of rising inflation expectations, one could rightly ask given recent market gyrations if the shot across the bows mark the end of financial repression and indicate trouble ahead for the Risk Parity investing crowd. On this subject we read with interest Deutsche Bank FX Special report from the 4th of February entitled "Risk Parity, FX and the end of financial repression:
"The charts below show that consecutive weeks of higher US bond yields and lower equity prices, have become progressively less common since the 1980s/1990s, and especially since the 2008 financial crisis. Three weeks, of equities down,10y yields up, has not happened for more than a decade. The bad news, is the markets may be contending with a shift in two big macro factors that point to a change in the post-2008 world: i) reduced financial repression, and, ii) some inflation creep
A look through history does show that in an environment where US 10y yields go up and equities go down, the USD tends to go up sharply versus the AUD and the JPY. The JPY loses out more from higher US yields than it gains protection from the retreat in risk appetite. In a higher 10y yield, lower equities environ, the USD has historically traded near flat versus the EUR, but in aggregate this still leaves the USD up moderately on a TWI basis. With bond and equity prices tumbling in the last week,the FX markets price action did conform remarkably closely to how the USD has traded in tough risk parity environments of the past, going back over the last 30 years.
Bond and equity prices falling sharply on the week may feel like an unusual environment, because in the last decade, it has become unusual. However, especially as we go back to the 1980s and 1990s it was a more frequent occurrence to see the following causal chain develop: Equities go up, supporting growth with a lag, pushing bond yields up, to the point where higher bond yields eventually pull equities down. In this way the equity - bond causality and correlation shifts, from a positive correlation where equities drive up yields, to a negative correlation as bond yields take the causal lead in pushing equities down.
From a macro perspective what is intriguing about this dynamic is two old school factors could be back in play: i) At least in the US there is a confluence of inflationary factors - lagged demand, tight labor markets, the tax reforms impact on wages/bonuses and growth, higher oil prices, latent protectionism, and the weak USD. All these factors are apt to have a cumulative effect, chipping away at global disinflation and inflation inertia. ii) the Fed and other Central Bank's balance sheet adjustments, may signal the end of financial repression, and this repression likely helped risk parity trades.  Risky assets are understandably worried because these are indeed important changes.
Now for the good news. Figure 1 below shows the number of weeks in each year where the S&P went up and the 10y yield went up. This was a common event in a high inflation era, but dwindled in the noughties, and especially after 2008 when the Central Banks went out of their way to support asset prices by supporting bonds. The good news that Figure 1 reveals, is it becomes very rare for the S&P and Bond yields to go up two and especially 3 or 4 consecutive weeks on the trot. Three weeks, of equities down 10y yields up has not happened for more than a decade.

Consecutive week after week of both bond and equity price declines is unusual. This is likely to prove true in current circumstances, where the US bond market is such a stand-out relative to other G10 bond markets. US 10y yields will likely not easily soar much above 3% without finding some real support, most obviously near the 3.03% January 2014 yield peak. In addition, were bond yields to keep on going higher, it would do enough damage to stocks to start hurting growth expectations, in turn supporting bonds. Bond bears would in this way create the source of their own demise, which is not an unusual self correcting mechanism.
In that sense we do not want to exaggerate the prospect of weeks like we have gone through that threaten risk parity trades consistently. At the same time, if inflation pressures and quantitative tightening are not about to change, then the weeks where both equities and bonds sell-off will become a good deal more frequent than we have seen since the Great Financial crisis.
So what does this all mean for currencies?
The Tables below shows how currencies have traded under different bond (10y yield) and equity (S&P) scenarios.
We first demarcate each week as falling into one of 4 scenarios: S&P up, 10y yield up; S&P up 10y yield down; S&P down and 10y yield down, and S&P down, 10y yields down. We then looked at how currencies traded, taking medians and averages of the weekly performances for ach scenario.
The table below shows the following:
i) The percent of time when S&P is down and 10y yields are up is roughly 1 in 6 trading weeks, so not all that unusual, but certainly less common than the other scenarios.
ii) In the environment where 10y yields go up and equities go down, the USD tends to go up sharply versus the AUD at least in the past decade. The USD also goes up substantially versus the JPY. The USD is mixed to near flat versus the EUR (or before the EUR the DEM). This leaves the USD up moderately on a Trade weighted basis. Since 1999, the USD also appreciates (somewhat less than we might expect) versus EM carry - using the Bloomberg EM-8 carry index of cumulative total returns. The USD's positive response versus EM looks much more substantial when using average weekly gains as distinct from median weekly gains. This suggests that every now and then there are some very large negative EM moves, when US bond prices and stock prices go down, which is not a huge surprise.
To summarize, past history does tend to support the thesis that when it feels like there is nowhere to hide between poor simultaneous trading conditions in the equity and fixed income markets, the USD and more recently the EUR have been the currencies to shelter in.
With bond and equity prices tumbling in the last week, the FX markets price action conformed remarkably closely to how the USD and other currencies have traded in tough risk parity environments of the past 30 years." - source Deutsche Bank
As a rule of thumb, positive correlation between growth assets is most notable when investors are most concerned about risk as we indicated in our May 2012 conversation "Risk-Off Correlations - When Opposites attract". Whereas opposite attracts during "Risk-Off" periods, it looks like the greenback is still working so far as a powerful magnet. As posited above rising positive correlation between macro variables in recent months should always be seen as instability brewing which increases the probability of a pull-back.

From a credit perspective, another shot across the bows is also coming from the Citi Economic Surprise Index (CESI) which could potentially indicate that economic fundamentals are trading ahead of themselves and could portend some credit spreads widening in the near future. On this subject we read Bank of America Merrill Lynch's take from their Securitization Products Strategy Weekly note from the 2nd of February:
"As nominal Treasury yields and breakeven inflation rates moved steadily higher over the past month (Chart 69), several market indicators we analyze suggest that the wind in the market’s sails may be fading.

As a result, the massive stock rally and price momentum experienced since the beginning of the year were thwarted this week as markets endured a spike in the VIX index and the worst weekly declines since 2016 (Chart 70).
Furthermore, the Citi Economic Surprise Index (CESI), which has previously been a decent indicator of the future direction credit spreads may take, continued to fall this week (Chart 71) while liquidity risk and financial stress, as measured by BofAML GFSI™ liquidity risk and financial stress indicators, rose (Chart 72).
Admittedly while the falling CESI could be somewhat seasonal in nature, the decline may also reflect the notion that expectations regarding economic fundamentals may have gotten ahead of actual fundamentals.
Historically, we’ve noticed a reasonably strong relationship between the inverse of Citigroup Economic Surprise Index and both the IG CDX (Chart 74) and HY CDX (Chart 75) indices: credit spreads tend to tighten as the CESI rises and vice versa.
With the CESI currently showing few, if any, indications that it may rebound over the near term, Treasury yields gapping higher and equity markets selling off, it is likely that credit spreads from other sectors will remain under pressure over the near term, which sets the stage for softer CMBS spreads as well." - source Bank of America Merrill Lynch
Is this time different when it comes to the relationship with rising yields, outflows and weakening CESI in recent weeks? We do not think so. 

At some point there is a potential strong risk reversal in US long bonds we think and that would put us back into the "deflationista" camp. For now the "inflationista" camp are having a field day but, as we pointed out be careful of what you wish for when it comes to inflation. Global rise in inflation expectations would indeed intensify the pressure on risky assets as we pointed out in our conversation "Who's Afraid of the Big Bad Wolf?". Remember what our friends say above according to the risk parity playbook, an investor should therefore increase his exposure to Treasuries alongside the Fed. In exchange for a minuscule return, the investor would, thus, face a substantial jump risk if the Fed had to apply a hurried “exit strategy” due to a surge in inflation…You have been warned, again...

Back in December in our conversation "Rician fading" we  reminded ourselves about the Laffer Curve which used to mean the following: "Too Much Tax Kills the Tax". With the upcoming Tax deals mostly benefiting the 1%, we mused that "Too Much Wealth Effects Kills the Wealth". In our final chart below we tackle again the "Wealth" defect.

  • Final charts - The "Wealth" defect
The wealth effect is the premise that when the value of stock portfolios rises due to escalating stock prices, investors feel more comfortable and secure about their wealth, causing them to spend more. According to the Fed and other central bankers following the same policies, the wealth effect should have enabled a repair of the balance sheet of households deeply impacted by the Great Financial Crisis (GFC). On top of the Wealth Effect thanks to ZIRP, NIRP and various QE iterations, the US has just implemented at the late stage of the credit cycle some "Trickle-down economics", also referred to as trickle-down theory. This economic theory advocates reducing taxes on businesses and the wealthy in society as a means to stimulate business investment in the short term and benefit society at large in the long term. However has shown in our final charts below from Wells Fargo Economics Group note from the 2nd of February 2018 entitled "The Rich Get Richer - Ownership Drives Net Worth", only the wealthiest American families have fully recovered from the financial crisis:
"Diverging Trends in Median and Mean Net Worth
Key indicators associated with household wealth might give the impression that balance sheets should be in much better shape than they actually are. Home prices, for example, are at or near their pre-recession peak in many markets. Stock prices are more than 80 percent above their prerecession peak. Yet, in inflation-adjusted terms, median household net worth is still about 30 percent below where it was back in 2007 (Figure 1).

Only the wealthiest American families have fully recovered from the financial crisis (Figure 2).
 - source Federal Reserve Board and Wells Fargo Securities
The outsized wealth gains recorded in recent years by high-net-worth families are reflected in the disparity between median and mean net worth, which have de-coupled since 2007. This is because “mean” net worth is calculated by taking the average net worth of all families, and is pulled up by very high values at the top of the distribution. Meanwhile, “median” net worth is that of the middle family (50th percentile), and is therefore not lifted by extreme values at the top of the net worth distribution, or impacted by changes isolated at either end of the distribution.
What Figure 1 shows is that before the financial crisis, net worth for the median American family was growing on a similar trend as net worth across all families. However, after 2007, high-net-worth families experienced much larger gains (or smaller declines) in net worth than middle wealth families. As a result, the mean – pulled up by wealthy families - did not show the same precipitous decline as median net worth post-financial crisis so the data does not track net worth growth of individual families. Rather, data from the SCF reflects how the distribution debt and asset ownership changes across society over time.
Fewer and Smaller Mortgages Reduces Debt
Changes in net worth occur because of growth (or decline) in debt and asset values. In the years after the Great Recession, middle- and high-net-worth families have reduced the quantity of debt on their balance sheets, contributing positively to net worth (Figure 3).
  - source Federal Reserve Board and Wells Fargo Securities
The median family with debt owed $59,800 in 2016, which is $18,200 less than in 2007 in real dollars. Mean family debt has similarly declined, down $22,500 since 2007 to $123,400.
Residential debt is the most commonly-owned type of debt after credit card debt, and makes up the largest share of debt that families hold. Therefore, trends in mortgage debt have a large influence on trends in overall family debt. A main contributor to debt reduction since the Great Recession is fewer, smaller mortgages. For mortgage owners, median and mean mortgage debt have both declined by about $13,500 since 2007. In addition, fewer families have mortgages: 40 percent of families in 2016, compared to 46.3 percent in 2007.
Lower debt among families is not just as a result of paying down mortgage balances, but also because fewer families are participating in the real estate market. The homeownership rate has declined from 69 percent in 2007 to less than 64 percent today. Whether by choice (preference for renting) or circumstance (tighter regulatory standards), fewer Americans have a piece of the American Dream in this expansion.
It’s Not What You Owe, it’s What You Own
The source of the divergence in median and mean net worth is asset values more than quantity of debt. Whereas the median family which holds assets owned about $256,500 worth in 2007 (in 2016 dollars), this has since dropped to $189,900 (Figure 4).
  - source Federal Reserve Board and Wells Fargo Securities
In contrast, the mean family with assets now values these at about $792,000, up from $775,900 just before the financial crisis.
This story has to do with the mix of assets that families of different wealth levels own, and trends in ownership rates. When looking at homeownership by net worth percentile, we see that the decline in homeownership is concentrated at lower percentiles of wealth. From 2007-2016, the share of families in the second quartile of net worth (25th-49th percentile) owning homes declined 14.1 percentage points to 58.1 percent, compared to a 2.2 percentage point decline in homeownership to 94.6 percent for families in the top decile of wealth (Figure 5).
  - source Federal Reserve Board and Wells Fargo Securities
The share of middle-wealth families owning other types of assets has also fallen at a faster rate versus high-net-worth families. Fewer families in the second quartile of the net worth distribution are owning vehicles (-1.5 points), retirement accounts (-5.5 points) and stocks (-4.3 points). Meanwhile, families in the top decile of net worth own stocks at a slightly lower rate (-1.8 points), but more own retirement accounts (+3.8 points) and about the same percentage own vehicles.
Lower asset ownership subtracts from net worth, since the value of asset holdings declines. Even for middle-net-worth families who own assets, they have not added as much to their holdings since 2007. Families in the second quartile saw retirement account and stock median values decline 13.8 percent and 5.7 percent, respectively. For families in the top decile, retirement accounts gained 71.3 percent and stocks 38.1 percent over the same period. This has exaggerated the pre-existing disparity in the value of asset holdings between middle and high-net-worth families (Figure 6).
 - source Federal Reserve Board and Wells Fargo Securities
The CoreLogic home price index has gained about 45 percent since its trough in February 2012. Meanwhile, the S&P 500 is up about 250 percent since its 2009 recession-low. The combination of lower asset ownership rates and smaller holdings for middle-wealth families, therefore, is a major reason that explains why mean family net worth has recovered since the Great Recession while median family net worth has languished." - source Wells Fargo

Some would argue that "Capitalism" has been seeding the seeds of its own destruction. As we posited in the past, bear markets for US equities generally coincide with a significant tick up in core inflation as we indicated again in our recent conversation "Bracket creep" until recently the US economy  has been plagued by "fixed income" (lack of wage growth) and "floating expenses" (healthcare and rents):
"Bracket creep describes the process by which inflation pushes wages and salaries into higher tax brackets, leading to a fiscal drag situation. Given most progressive tax systems are not adjusted for inflation, as wages and salaries rise in nominal terms under the influence of inflation they become more highly taxed, even though in real terms the value of the wages and salaries has not increased at all. The net effect overall is that in real terms taxes rise unless the tax rates or brackets are adjusted to compensate. That simple" - Macronomics, January 2018
After all it seems that the "Wealth defect" could be leading in the end to trickle-down "inflation" but the wrong one, but, we digress again... 


"The best way to destroy the capitalist system is to debauch the currency." - Vladimir Lenin
Stay tuned ! 
 
View My Stats